Public health career outcomes
Every year, first-time and repeat College of Public Health Buckeye graduates venture into the next phase of their professional lives, well-prepared and eager to improve health and well-being in their communities thanks to their degree from the No. 1 college of public health in Ohio and one of the best programs in the nation.
Our graduates in the MS, MPH and PhD programs specialize in biostatistics, environmental health sciences, epidemiology, health behavior and health promotion, health services management and policy, veterinary public health, the Program for Experienced Professionals and clinical translational science.
If you would like statistics on the Master of Health Administration, you may review the latest MHA career outcomes.
The following statistics reflect career outcomes for the graduating classes between Autumn 2018 to Summer 2021.
Job titles and employers
| Job title | Employer |
|---|---|
| Certified Clinical Research Coordinator | The Ohio State University Wexner Medical Center |
| Research Assistant | Fenway Health |
| Resident Clinician | The Buckeye Ranch |
| Laboratory Scientist | Ohio Department of Health |
| Academic Program Coordinator | George Mason University |
| Epidemiologist II | Texas Department of State Health Services |
| Health Services Policy Specialist | Ohio Department of Mental Health and Addiction Services |
| Staff Epidemiologist | United South and Eastern Tribes |
| Consultant | Guidehouse |
| Program Associate | USAging |
| Research and Data Analyst | Case Western Reserve |
| Environmental Compliance Specialist | Univar Solutions |
| Disease Intervention Specialist | Columbus Public Health |
| Scientist | Allen Institute |
| Health Outcomes Researcher | Cerner Enviza |
| Business Intelligence Analyst | Beaumont Health |
| Medical Doctor | The Ohio State University Wexner Medical Center (Obstetrics and Gynecology) |
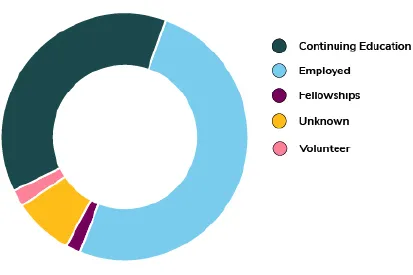
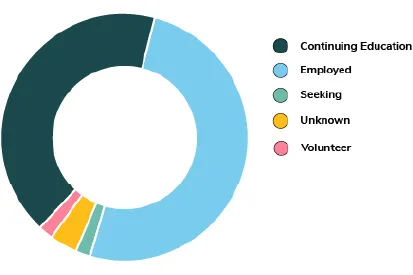
Graduate career outcomes
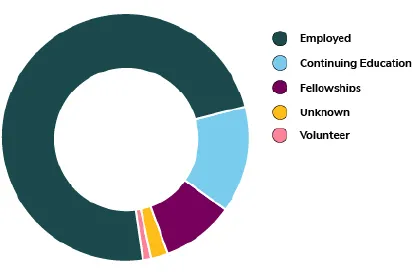
2020-21
- Total graduates - 94
- Employed - 69 (73.4%)
- Continuing Education - 13 (13.8%)
- Fellowships - 9 (9.6%)
- Unknown - 2 (2.1%)
- Volunteer - 1 (1.1%)
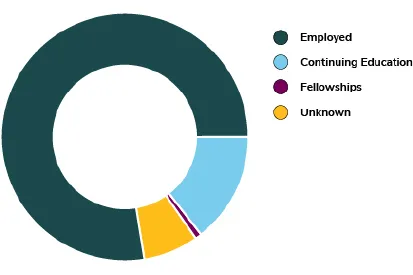
2019-20
- Total graduates - 112
- Employed - 87 (77.7%)
- Continuing Education - 16 (14.3%)
- Fellowships - 1 (0.9%)
- Unknown - 8 (7.1%)
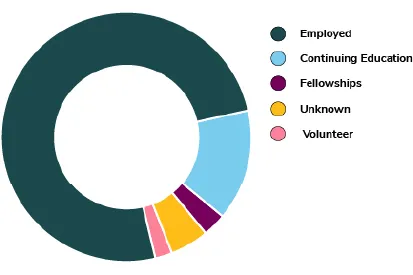
2018-19
- Total graduates - 101
- Employed - 74 (73.3%)
- Continuing Education - 14 (13.9%)
- Fellowships - 3 (2.9%)
- Unknown - 5 (4.9%)
- Volunteer - 2 (1.9%)
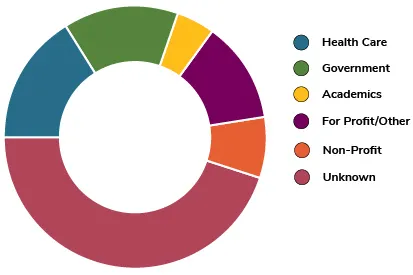
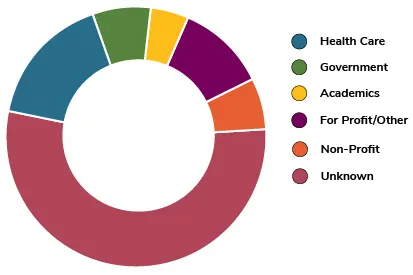
Employment outcomes by sector
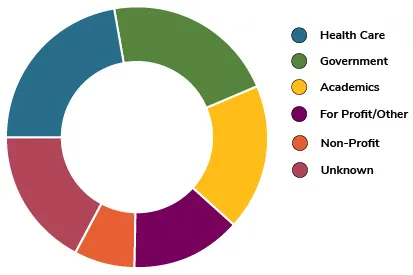
2020-21
- Health care - 21 (22.3%)
- Government - 20 (21.3%)
- Academics - 17 (18.1%)
- For-profit/Other - 13 (13.8%)
- Non-profit - 7 (7.4%)
- Unknown - 16 (17.0%)
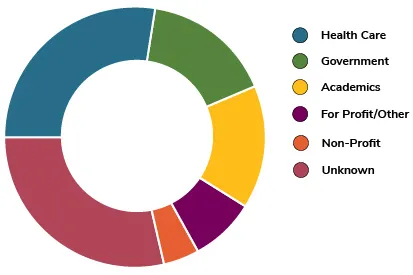
2019-20
- Health care - 31 (27.7%)
- Government - 18 (16.1%)
- Academics - 17 (15.1%)
- For-profit/Other - 9 (8.0%)
- Non-profit - 5 (4.5%)
- Unknown - 32 (28.6%)
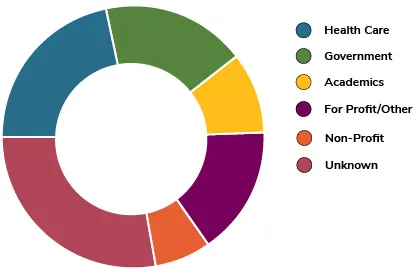
2018-19
- Health care - 22 (21.8%)
- Government - 18 (17.8%)
- Academics - 10 (9.9%)
- For-profit/Other - 16 (15.8%)
- Non-profit - 7 (6.9%)
- Unknown - 28 (27.7%)
Job titles and employers
| Job title | Employer |
|---|---|
| Public Health Advisor | Centers for Disease Control and Prevention |
| Health Analyst | IMPAQ International |
| Senior Analyst | Cardinal Health |
| HIV/AIDS Volunteer | Peace Corps |
| Clinical Research Coordinator | Nationwide Children's Hospital |
| Case Investigator | Columbus Public Health |
| Immunization Registry Analyst | Ohio Department of Health |
| Business Analyst | Truist |
| Program Director | National Student Leadership Conference |
| Public Health Investigator | Franklin County Public Health |
| Community Health Worker | OhioHealth |
| Childhood Health Engagement Coordinator | National Health Corps |
| Environmental Health Practitioner | Henry and Stark County Health Department |
| Healthcare Assistant | Planned Parenthood |
| Quality Improvement Coordinator | Centene Corporation |
| Overdose Prevention Outreach Worker | Columbus Public Health |
| Onboard Public Health Officer | Carnival Cruise Line |
| Environmental Health Specialist | Yakima Health Department |
| Case Manager | CoverMyMeds |
| Data Analyst | The Ohio State University |
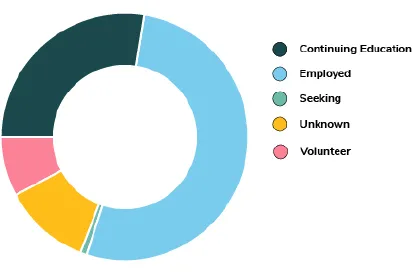
BSPH career outcomes
2020-21
- Total graduates - 102
- Employed - 51 (50.0%)
- Continuing Education - 38 (37.4%)
- Fellowships - 2 (1.9%)
- Unknown - 8 (7.8%)
- Volunteer - 2 (1.9%)
2019-20
- Total graduates - 105
- Employed - 55 (52.4%)
- Continuing Education - 29 (27.6%)
- Volunteer - 8 (7.6%)
- Unknown - 12 (11.4%)
- Seeking - 1 (1.0%)
2018-19
- Total graduates - 106
- Employed - 55 (51.9%)
- Continuing Education - 42 (39.6%)
- Volunteer - 2 (1.9%)
- Unknown - 5 (4.7%)
- Seeking - 2 (1.9%)
Employment outcomes by sector
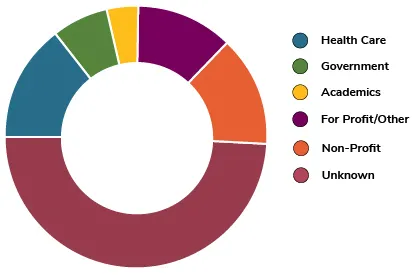
2020-21
- Health care - 15 (14.7%)
- Government - 7 (6.8%)
- Academics - 4 (3.9%)
- For-profit - 12 (11.8%)
- Non-profit - 14 (13.7%)
- Unknown - 50 (49.0%)
2019-20
- Health care - 17 (16.2%)
- Government - 15 (14.3%)
- Academics - 5 (4.8%)
- For-profit - 13 (12.4%)
- Non-profit - 8 (7.6%)
- Unknown - 47 (44.8%)
2018-19
- Health care - 18 (16.5%)
- Government - 8 (7.3%)
- Academics - 5 (4.6%)
- For-profit - 12 (11.0%)
- Non-profit - 7 (6.4%)
- Unknown - 59 (54.1%)
Data is based on the number of respondents who reported their career outcome.